According to the UN, around 2.5 billion more people will be living in cities by 2050, with most of this increase coming from population growth and population movements in the Global South. We need new tools to understand how our cities are growing and changing over time, so we can ensure that all of their inhabitants are accounted for in decision-making and the planning of essential services like running water and electricity.
Today we’re expanding our Open Buildings project, which aims to help various organizations understand and plan for our changing world, with a new dataset that includes information about how building presence changes over time. The Open Buildings 2.5D Temporal Dataset is now available for the years 2016-2023, and also includes information about building heights for the first time.
Why mapping buildings matters
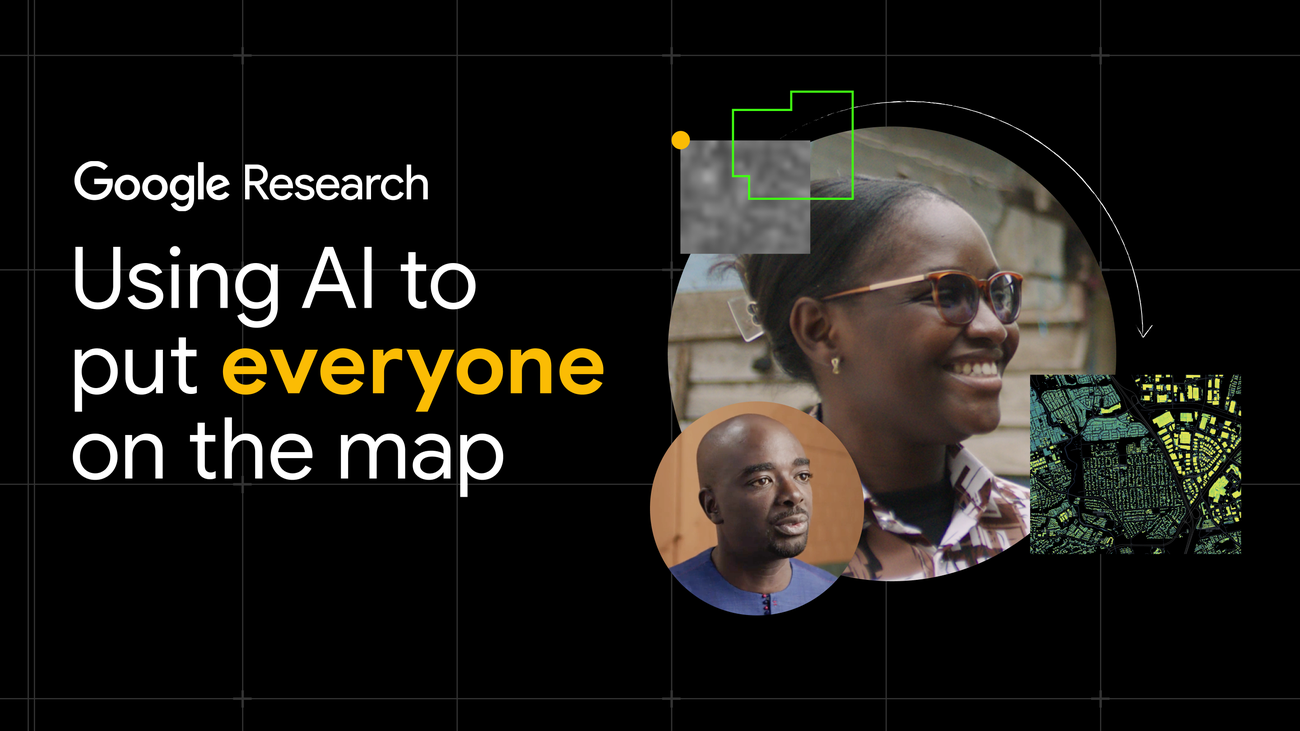
Maps are a lifeline to many things we need. For people to receive essential services, like electricity and running water, and to be accounted for in crisis response, decision-makers need to first know where they are. By creating maps, we can help decision-makers understand the current environment and ensure that everyone is reached. That’s why Google Research introduced the Open Buildings project in 2021. This project, which started in our AI Research Lab in Accra, Ghana, has mapped 1.8 billion buildings across Africa, Asia, Latin America and the Caribbean, covering about 40% of the globe and about 54% of the world’s population.
Over the past few years, governments, humanitarian organizations, researchers and companies have used the Open Buildings dataset for a variety of projects. For example, Sunbird AI, a Ugandan nonprofit, used the Open Buildings dataset to prioritize areas for rural electrification projects to deliver the greatest impact in places with the most need. This kind of data can be useful for a variety of purposes, and we’ve also used it to improve the accuracy of Google Maps, adding buildings across the world to the map.
Over time, as partners used the data for their projects, important questions began to emerge: When were these buildings constructed? How has this city or settlement changed over time? What did this place look like before a recent crisis event and what does it look like now?
Getting answers to these questions can be difficult or sometimes impossible, for a variety of reasons. For example, in low- and middle-income countries where resources are often scarce, this kind of data may not exist. Conflict may be prevalent, preventing data from being recorded. Or the terrain itself may pose obstacles. But with the world’s population growing by over 80 million annually, access to this information is more important than ever, especially for government agencies, humanitarian organizations and researchers studying development trends and urbanization.
How we produced this new dataset
To produce this dataset, we used AI to super-resolve and extract building footprints and heights from publicly available, lower-resolution imagery from the Sentinel-2 collection. This is important because lower-resolution satellite imagery is more available for the Global South than high-resolution imagery, so we needed to create models that could accurately classify buildings with these lower fidelity images.
We’re sharing our technical report as well as an interactive Earth Engine App so anyone can explore our methods and results in greater detail.
We’re also making the Open Buildings 2.5D Temporal Dataset freely available to support the work of policymakers, humanitarian organizations and others working in the Global South. It’s hosted as an ImageCollection in the Earth Engine Data Catalog (link), where it can be analyzed with Earth Engine’s planetary-scale computation capabilities and vast catalog of other environmental datasets.