We have a strong culture of continuous improvement at AdAction, particularly in the tech department. Our goal is to be an always-improving team that quickly and efficiently delivers high-quality products. As such we want all of our teams to have the opportunity to improve and perform at the highest level possible.
However, the path to improvement is invisible without a yardstick to measure progress. For qualitative insights into team health, we’ve embraced the model pioneered by Spotify, utilizing team health checks to identify areas for enhancement at both the team and organizational levels. Yet, the quest for a quantitative measure of performance led us to the DevOps Research and Analytics (DORA) metrics developed by Google. Despite their promise, we encountered challenges in calculating and leveraging these metrics effectively.
In this article, we’ll explore our interpretation of the individual DORA metrics, alongside the challenges we encountered in their implementation. For those new to DORA metrics, a practical first step is conducting a quick assessment. We recommend beginning with a straightforward evaluation available at DORA’s Quick Check, which guides you through a series of questions to gauge your current standing.
There are four core metrics that Google initially defined in its original post. They developed these metrics through six years of research and believe the combination of which indicates how well a team is performing (at least as far as DevOps goes). The four metrics are:
- Deployment Frequency – How often is a team shipping to production?
- Lead Time for Changes – How long does it take for a commit to make it to production?
- Change Failure Rate – The percentage of deployments that create a failure in production.
- Time to Restore Service – How long does it take to recover from a failure in production?
You can see a theme that all these metrics relate to code in production. The Dora team identified four classes of team performance (Elite, High, Medium, Low) which become evident from these metrics:

Our interpretation of Dora Metrics
Before we could start collecting and monitoring these metrics, we needed to align on what exactly each one meant to AdAction.
Deployment Frequency
This was the only straightforward metric for us, simply how often do we release new versions of our codebases to production.
Lead Time for Changes
This is a little more debatable. What are we really trying to measure? The speed of development, or the speed at which a team takes finished code and makes it live. These are two very different things, each with its own merits. Which you choose dictates how you will measure. We first looked at the time from PR open until that code was deployed. In time, due to the nature of the tooling we used for measuring, we switched to a commit time until deploy model.
Change Failure Rate
For us this was a less clear metric. What constitutes a “failure”? The Dora report indicates a percentage of deployments causing failures. Does this mean an incident due to a CD deployment error or any outage due to faulty code in production? We had strong proponents in both camps. This is still in flux and is largely controlled by what tooling we use. Once failures are identified, the failure rate will be the number divided by the number of total deployments.
Time to Restore Service
Before this, we must answer the question of what is a failure. Identifying failures accurately is crucial, as it directly impacts our ability to measure and improve our response times.
Collecting the Metrics
Once we decided on what these metrics meant to us, we needed to collect them. The Google DORA team released the project Four Keys for gathering these metrics from GitHub or GitLab. However, the project makes extensive use of Google Cloud, and we’re an AWS shop.
What’s more, as of January 2024, the project is no longer maintained, and the source code is archived on Github. So, that left us on our own to gather these metrics. We explored several options and finally landed on Datadog Dora metrics as our solution. We will be detailing the setup of Datadog for Dora metrics, but first, let’s discuss the other solutions we considered.
Attempt #1 – Jira and Github APIs
To begin with, we wanted to go to the original source for this data. Jira’s roots as an issue tracking system lent itself to tracking failures. With Github the combination of PRs and github actions would allow us to measure both lead time to change and deployment frequency.
In Jira, we created a new issue label (called SystemFailure) to flag bugs that we considered a full failure or outage. Then, we added a couple of fields to reflect the start and stop of the outage. Using the following prototype python code we could pull stats for Time to Restore Service using Jira’s API:
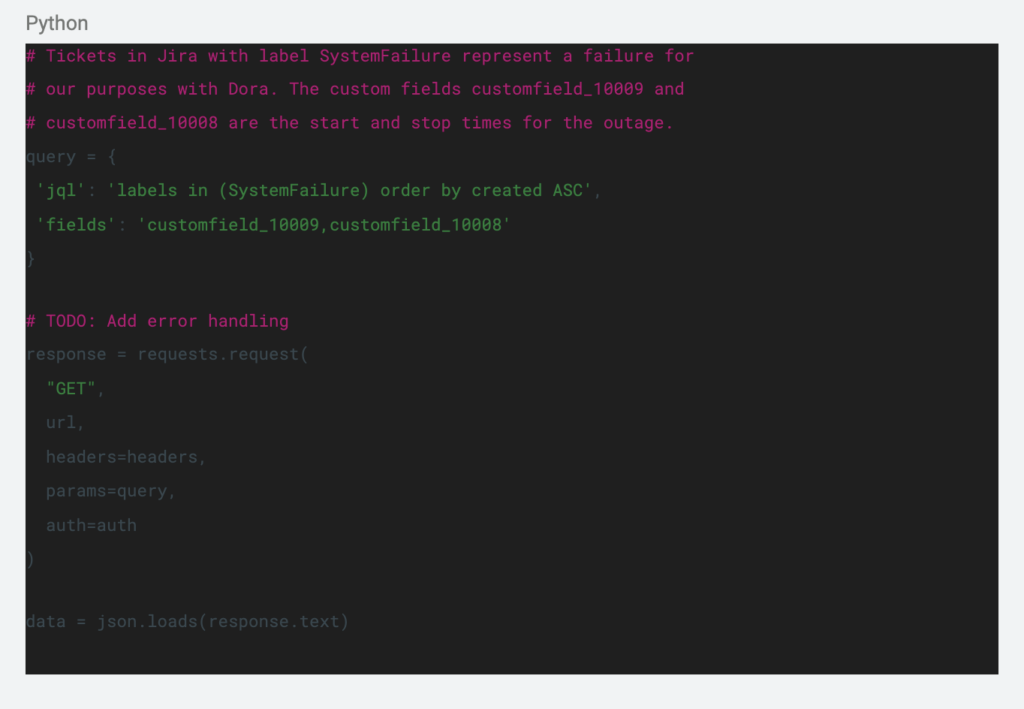
There was a big downside to this approach. It relies on a human to populate the correct fields in Jira. We’re strong believers in automation, so this manual step really felt wrong. For github, we started with pulling PR statistics with this code:
https://github.com/AdGem/dora-metrics
At this point, we realized we didn’t want our extraction code to be doing our analytics, rather we’d like to pull raw data and do our analytics using BI tools. In a sense, we’d like to treat it as an Extract Load Transform (ELT) problem.
Attempt #2 – Airbyte (untested)
At that point, we thought “ELT? We know ELT.” For the past few months we’ve been building a new Data infrastructure stack around No/Low code ELT solutions. For extraction, we’ve used Airbyte. Fortunately, Airbyte has connectors for both Jira and Github, so we could extract from our original sources and eliminate the need for custom code. However, that’s about as far as we got with the idea, as our (hopefully) final solution came to our attention.
Attempt #3 – DataDog
As you may know, we love observability and Datadog. So when we were invited to join Datadog’s Dora Metrics beta, we dropped everything to participate. Datadog’s solution promises to solve many of the challenges we face with pulling data together, all in a single stop.
Datadog Setup
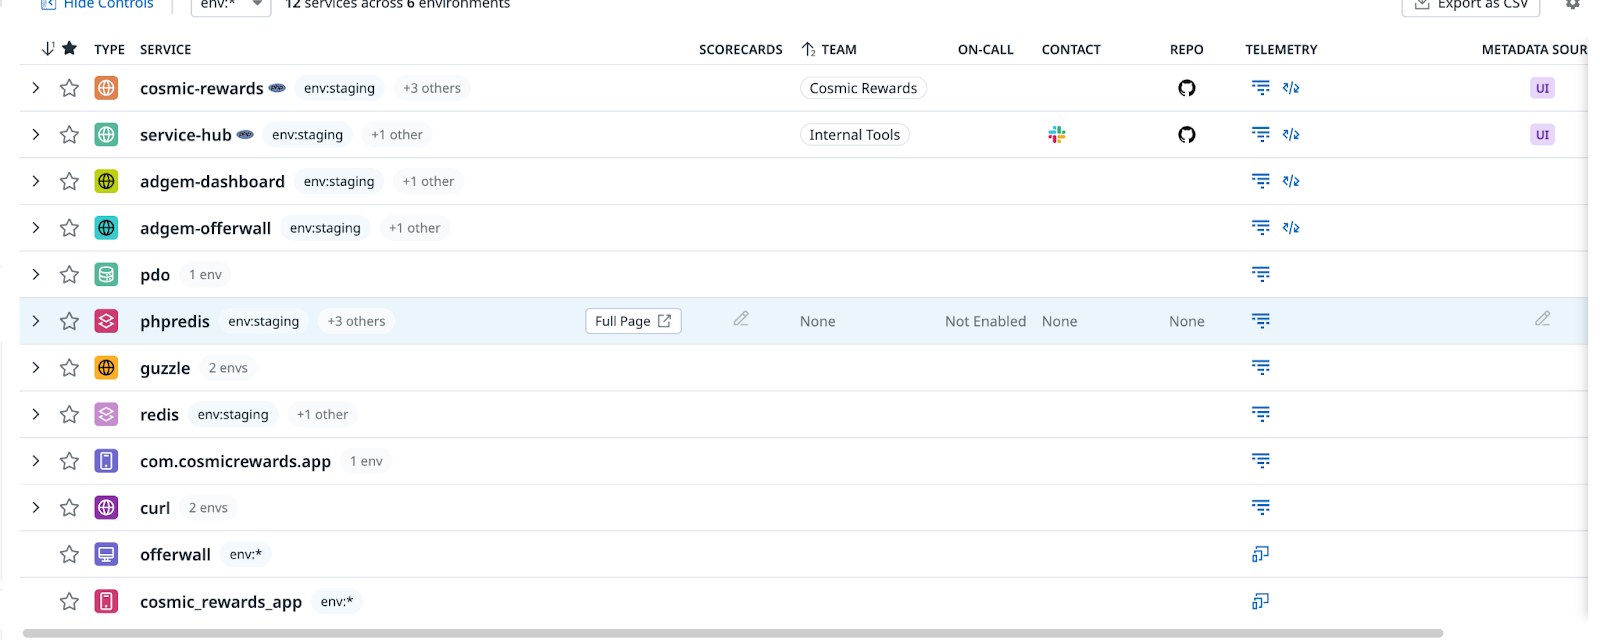
Before setting Dora metrics one of the first things that we did was to register the services to the Datadog’s service catalog, which provides a consolidated view of our services it includes details such as service name, environment, and repository:
Deployment Frequency
To get this metric there are 3 values that are required:
- Started_at: Unix timestamp in nanoseconds when the deployment started.
- Service: Service name from a service available in the Service Catalog.
- Finished_at: Unix timestamp in nanoseconds when the deployment finished. It should not be older than 3 hours.
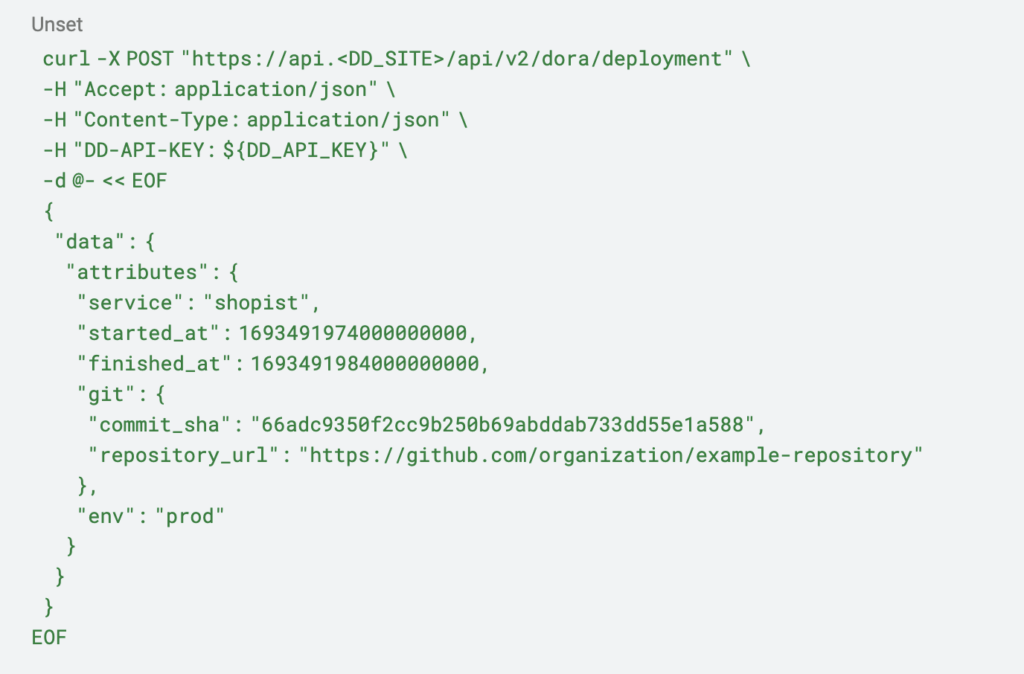
You could either use the Datadog API Or Datadog-ci to send the deployment events. Example using the Datadog API at https://api.datadoghq.com/api/v2/dora/deployment:
Example with Datadog-ci:
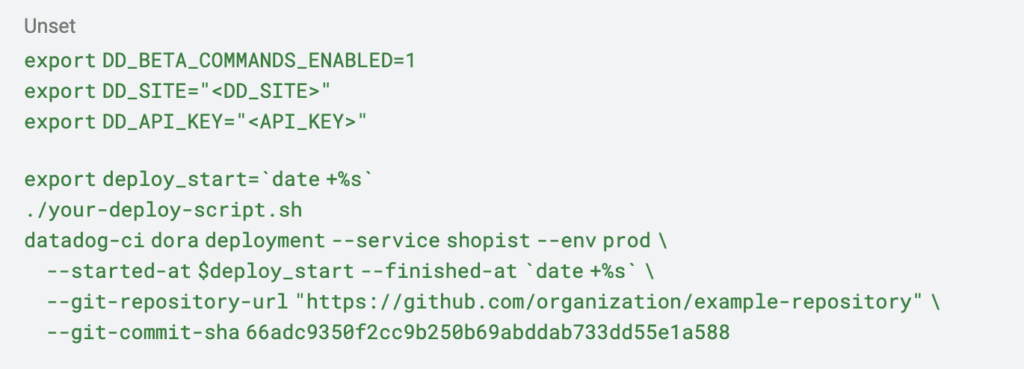
We choose to use datadog-ci in the pipeline so it sends the data for each deployment. To install the datadog-ci and export the required environment variables:
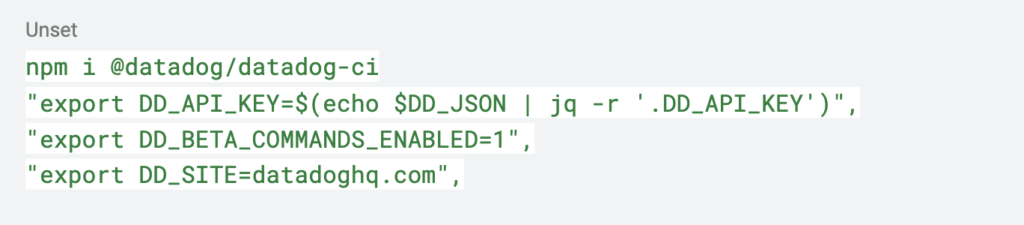
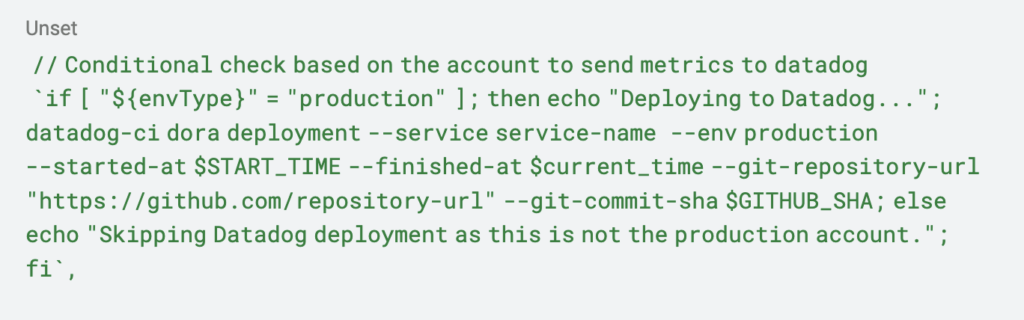
Here is an example of how to send the deployment events to Datadog, in this case, we validate that is sending data through the production pipeline, we used the tag – – env to tag production deployments:
Lead Time for Changes
According to Datadog, for change lead time to be available, you must send deployment events while your repository metadata is synchronized to Datadog. The deployment events must include the repository_url and commit_sha fields as seen in the last example. Datadog provides a GitHub integration on the GitHub integration tile:

It allows you to synchronize your repository metadata automatically.
Change Failure Rate
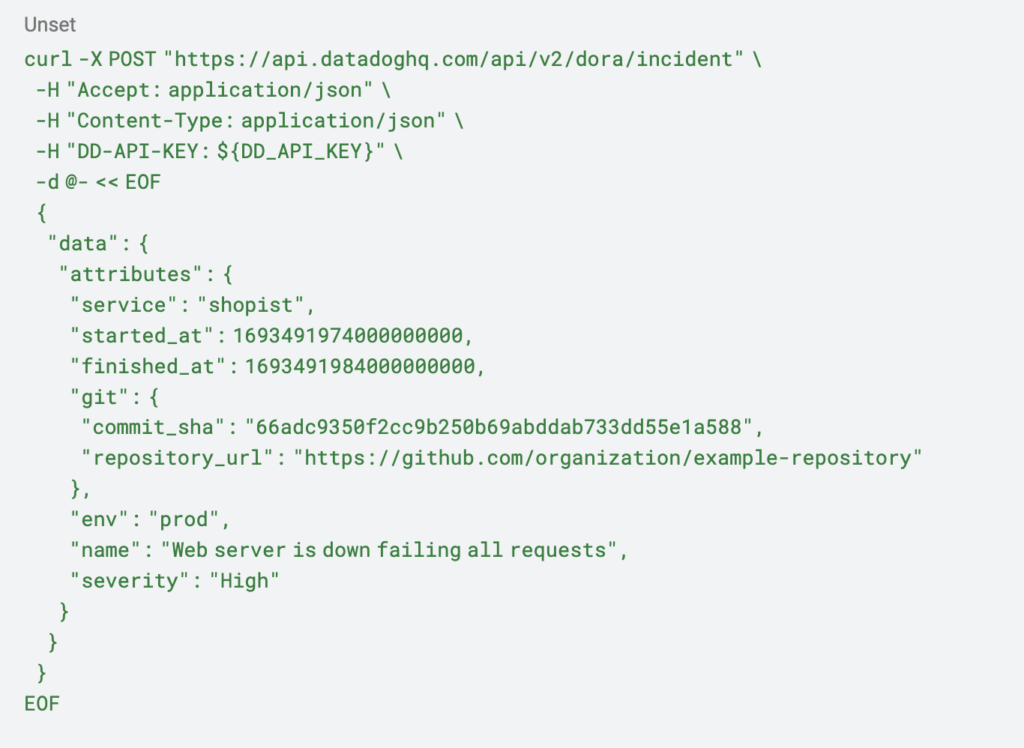
You can submit incidents using the DORA metrics API. The only attributes that are required to send incidents:
- service:name from a service available in the Service Catalog.
- started_at:Unix timestamp in nanoseconds when the incident started.
You can optionally add more attributes as you can see in Datadog’s API:
- repository_url
- Commit_sha
- Name
- severity
https://api.datadoghq.com/api/v2/dora/incident
In our pipeline there are some incidents that we can automate in this case after each deployment there is a DeploymentCheckStep that validates that there is not an app version mismatch:
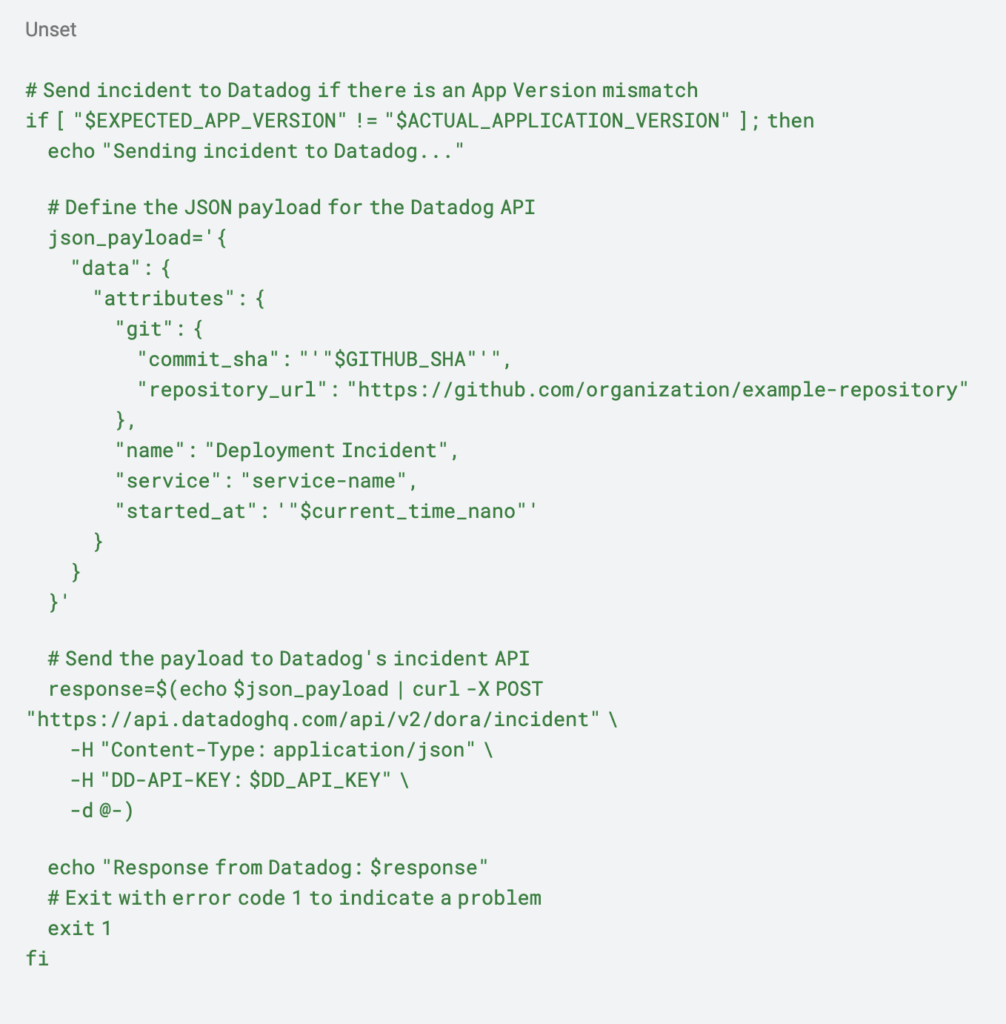
- Missing dependencies
- Service downtime or unavailability
- Threshold breaches for performance metrics
- Security vulnerabilities detected
- Critical logs or error patterns identified
Time to Restore Service
In our continuous delivery pipeline, automating the reporting of incidents is crucial we don’t want to only notify that there is something wrong, but also marking incidents as resolved when there is an outage that is fixed. Resolved incidents are incidents that include finished_at.
This means that you can reuse the same endpoint as when you are reporting an incident, but the key difference is that you must include the finished_at which is described Unix timestamp in nanoseconds when the incident finished. It should not be older than 3 hours.
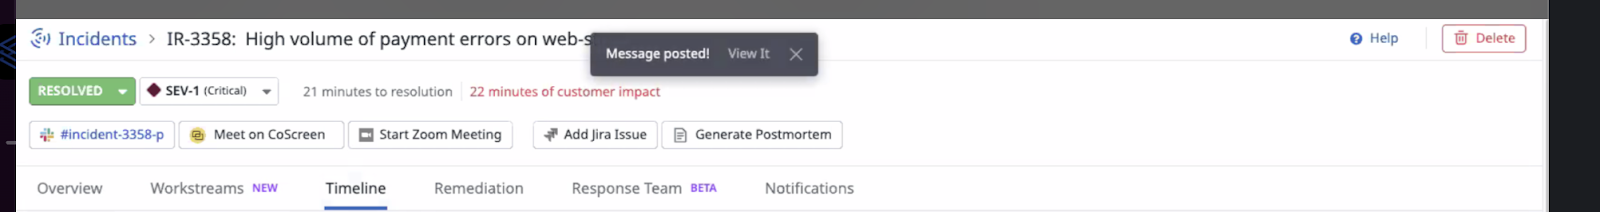
The automation of resolved is not straightforward. However, Datadog offers you an integration with Jira to automatically create a Jira Issue and Slack to automatically create a Slack channel for each new incident where you could automate the resolution of the incidents created before.
You could also automate the creation of incidents using Datadog’s workflows which allows you to orchestrate and automate your end-to-end processes.
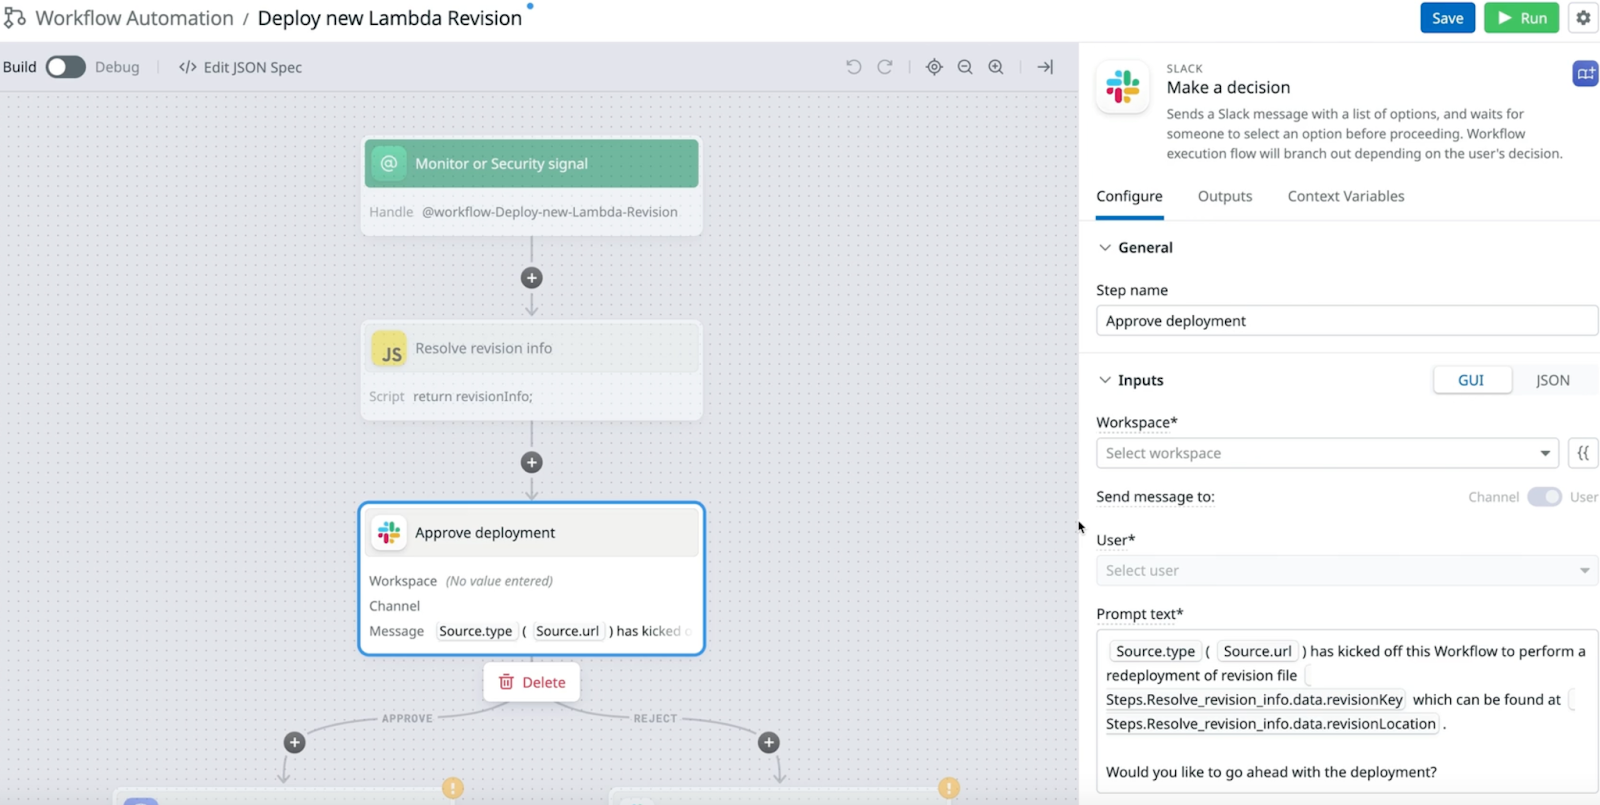
https://docs.datadoghq.com/service_management/workflows/
These are some hoops to jump through though. In the future, we hope Datadog will integrate Dora failure tracking with their built-in incident management solution, making for seamless failure tracking.
Results
After setting up the Datadog dora metrics you will get some charts for each dora metric, you can filter them by team, service , environment, repository and date.
Deployment Frequency
How often an organization successfully releases to production: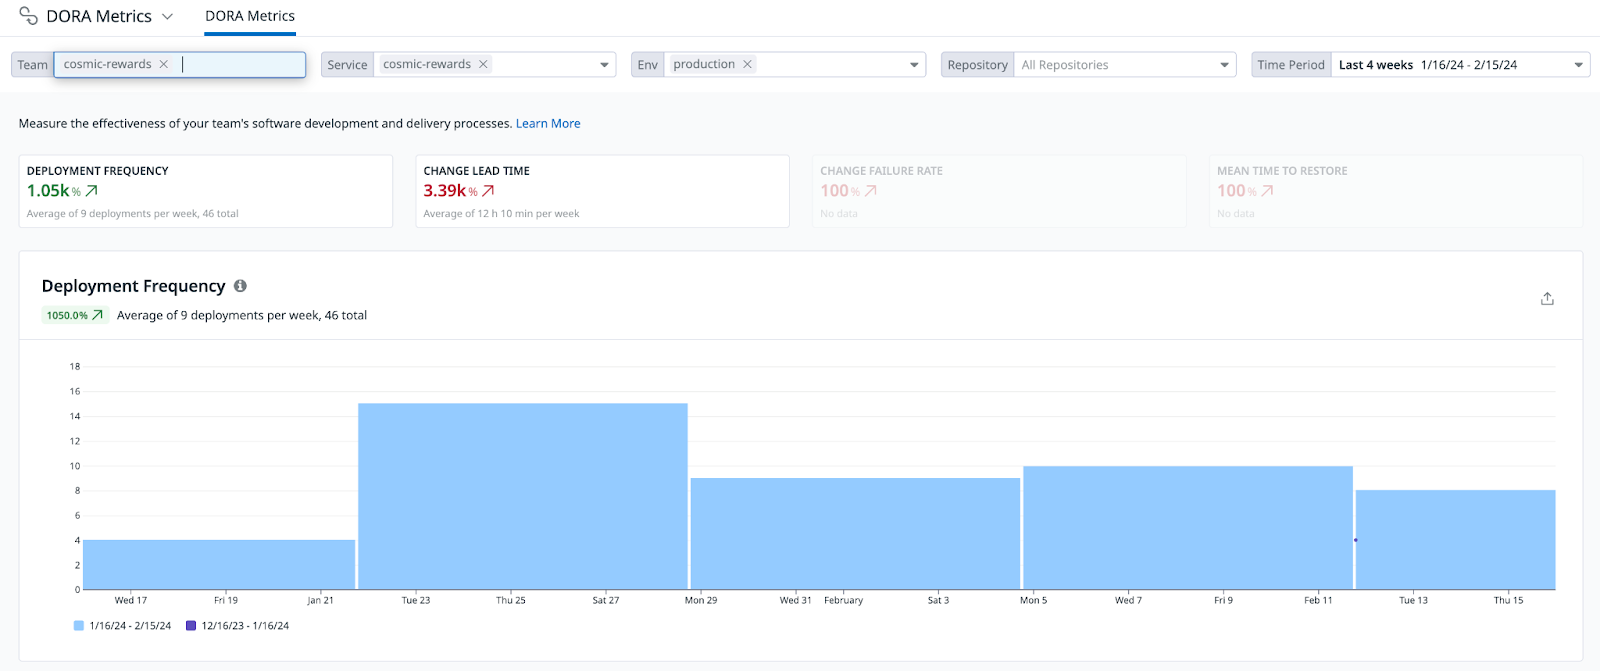
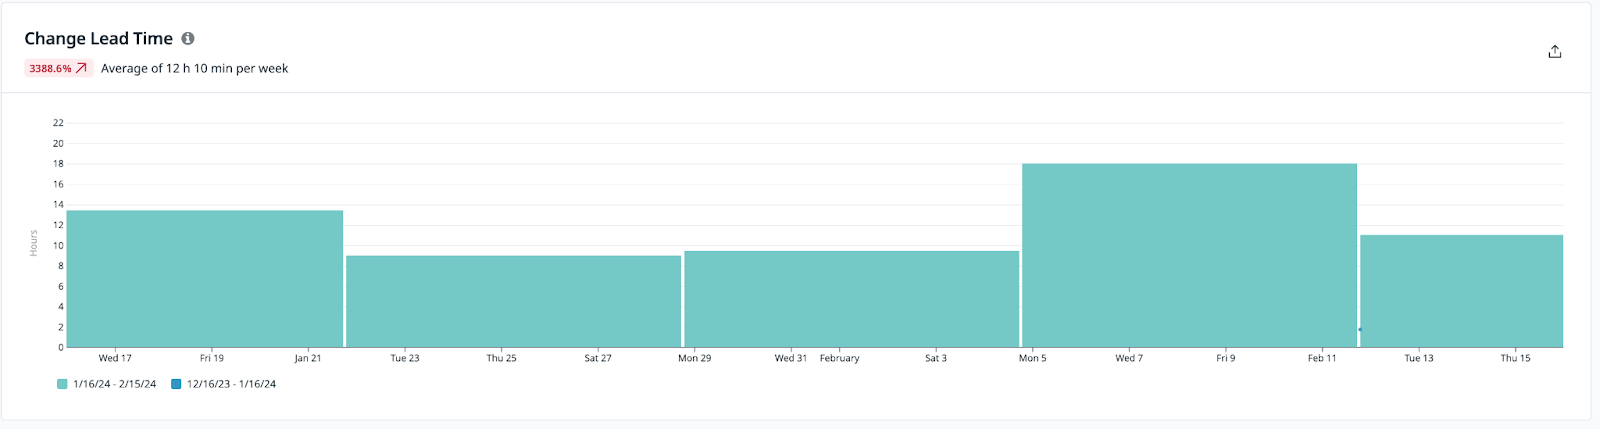
Lead Time for Changes
The amount of time it takes a commit to get into production:
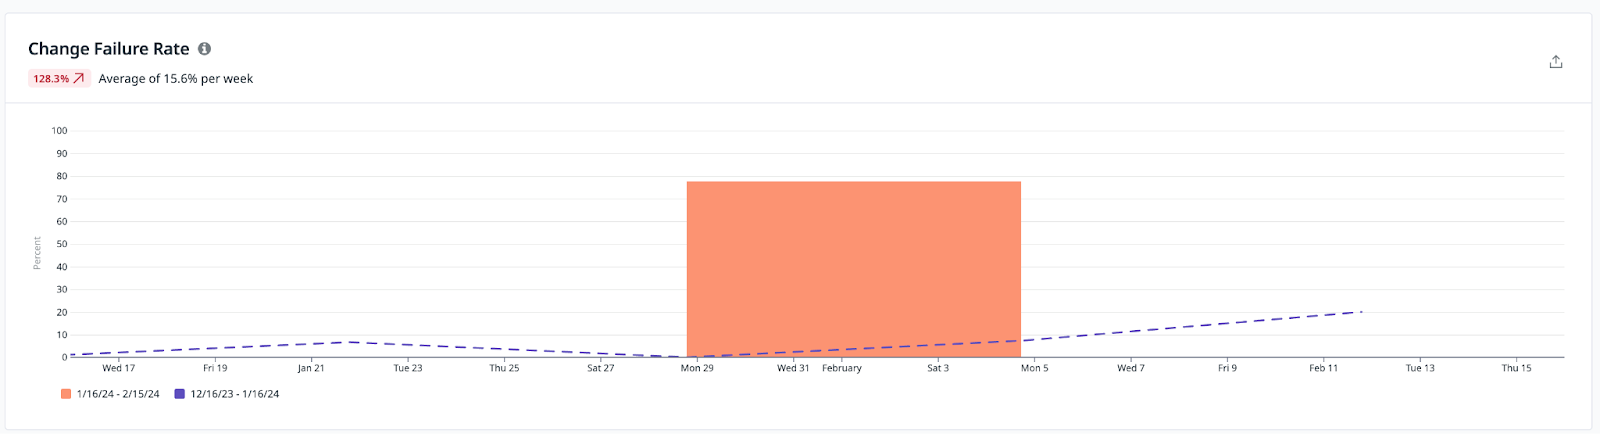
Change Failure Rate
The percentage of deployments causing a failure in production:
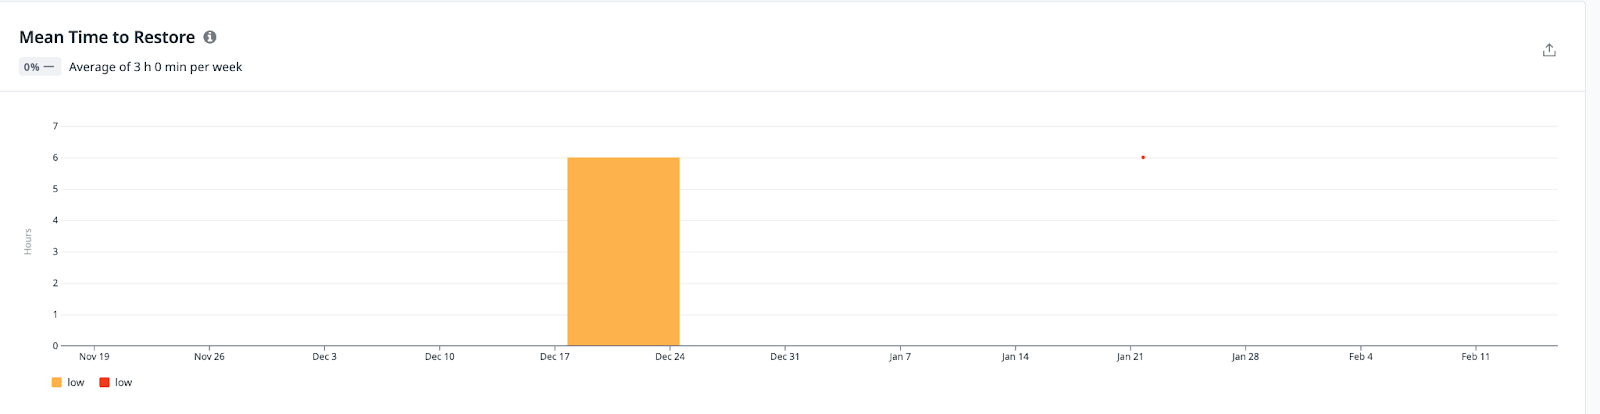
Time to Restore Service
How long it takes an organization to recover from a failure in production:
Findings
DORA Metrics Offer Valuable Insights
DORA metrics are great for measuring and comparing your teams and to see how they fit in the industry standards. You may think your teams are doing great, but are they really? This is why assessments are important.
Early Implementation and Challenges
We are still in the early stages of our journey with Dora metrics. They are very promising for helping teams succeed. However, it’s far from trivial to pull these metrics together. It appears we’ve found a solution to our data collection woes in Datadog. However, failure tracking still leaves a bit to be desired. We’ve only just begun to collect these metrics, and only for a single team so far. Perhaps in a few months, we’ll revisit this topic and share how it’s impacted our teams.
Importance of Holistic Assessment
That being said, it’s crucial to look beyond DORA Metrics and consider other factors contributing to successful business outcomes. Like focusing on delivering a whole new feature in production rather than evaluating some pieces of code delivered into production.
Potential Benefits for Team Efficiency
Dora metrics can offer good feedback on efficiency and stability. This may not appear critical to a developer to measure how fast they merge their code, but if you start categorizing teams this could encourage the teams to be faster and more efficient when delivering code to and be elite performers and if they are not in that category.
Cautions Against Comparisons
We think it is important to avoid misconceptions. These metrics should not be a competition to measure which are our good teams and which are our bad teams or set up a competition amongst them , it will always depend on the Context, each team is different, you can’t compare pears with apples. I think it is about improvement.
References
- Google Cloud Blog – “Are you an Elite DevOps performer? Find out with the Four Keys Project” Link
- Google Cloud Blog – “The 2019 Accelerate State of DevOps: Elite performance, productivity, and scaling” Link
- Spotify R&D – “Squad Health Check model – visualizing what to improve” Link
- Datadog “Dora Mertics” Link